Mapping Concordia’s Sustainability Ecosystem, a system mapping experiment
Concordia University
Project Overview
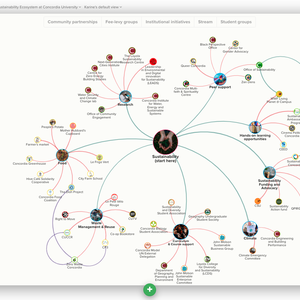
Tristan Harris, the founder of the Center for humane Technology, once said: "Our ability to meet the world's challenges depends on us making sense & coordinating together." It means that to address the challenges of the 21st century, we need to create a common framework for "making sense" of the current situation. This is where the importance of mapping sustainability comes in. At Concordia University, we have a complex and ever-changing web of institutional initiatives, student groups, and fee-levy that interact and advance our sustainability efforts. Complexity can often equate to chaos; one way to make sense of the mess is to apply system thinking to identify underlying patterns (Burnes, 2005). Using this framework, I built a representation of sustainability at Concordia that is simple enough to be grasped by our minds and detailed enough to inform decision-making. By building a map of Concordia's sustainability ecosystem, I am bringing clarity to what is available for students and the community. I am also highlighting weaknesses in the system for decision-making purposes.
Background
Concordia's Sustainability Culture and Literacy Assessment (December 2021) found that 52% of students and 59% of faculty/staff agree with the statement "I would like to learn more about sustainability." The assessment also showed that only a tiny percentage of students know of Concordia's sustainability commitments and initiatives. This past year, I was a sustainability ambassador at Concordia University. I got into the program because I needed a doorway to the field as an economics student interested in sustainability. I had no formal training in sustainability issues, but I had always been highly involved on campus and in the social economy space. Throughout the first couple of months of the program, I volunteered with various organizations and learned about everything available on campus. One idea kept popping up: " We have so much going on, but nobody knows what is available." As a sustainability ambassador, I felt the need to bring in an interdisciplinary approach to mapping sustainability. Instead of just focusing on one aspect of sustainability (climate or biodiversity conservation), I wanted to connect various parts of the puzzle and show that we form a community, a complex system that supports each other.
Goals
Goal 1: Combat over-simplification By simplifying our representation of sustainability and only focusing on some aspects of the topic, we ignore the interconnectedness of the problems we face. This oversimplification is causing us to miss complex systems dynamics such as feedback loops and interactions between organizations. That causes policy and solutions to fail. Like Lewis Thomas (1974,p.90) said: “ If you want to fix something, you are first obliged to understand… the whole system…Intervening is a way of causing trouble.”
Goal 2: Combat the identification trap Shifting the thought patterns away from linear patterns and hierarchical representations of communities challenges us to enlarge our vision of what sustainability means. It also pushes us to identify ourselves as part of the system since most people have interacted with at least one organization on the map. We then begin to understand the interconnectedness of it all. Our lack of understanding of systems theory prevents us from understanding our place in the systems we belong to. “We are not puppet masters influencing a system out there — we are embedded in the system.” (Business Dynamics, J. Sterman Sterman, 2000)
Goal 3: Make the education process more engaging
It is not a secret anymore that, as a generation, we have attention problems. With the abundance of distractions and fake news, it is hard for the population to get accurate and reliable information. This is where intelligent and humane design comes in. By building an open-source and interactive map, we recognize that people need to engage with the knowledge to absorb it (interactive design). We also encourage people to develop their versions of the system by making the code available to them (open-source).
Implementation
Step 1: Conceptualizing Mind maps inspired the design of my map; as a result, the desired appearance of the final product was clear to me when I started. Then I also knew that I wanted to make it fun for people to navigate. So I started by drawing a picture of what it could look like.
Step 2: Define requirements for the project Since I wanted to work with the Office of Sustainability and get the input of Zero Waste Concordia, I had multiple meetings with these teams to set up expectations for the project. It was also a way for me to learn what had already been done and understand previous mistakes when attempting a project like this one.
Step 3: Execution
I started looking for information about systems theory and how to build system maps in Fall 2021. Once I had enough foundational knowledge about what I was attempting to do, I started making the map in consultation with the sustainability ambassador program coordinator. During this step, I also consolidated a network of stakeholders and consultants at the school with expertise in sustainability that I did not have.
Step 4: Get feedback and finalize the project
Once the first draft was done, I set up meetings with stakeholders to get their feedback on the advancement of the project and my direction. After every meeting I would apply modifications to my project as suggested. I was also taking the team to talk about possible marketing strategies we could use to promote the project.
Timeline
October 2021- Conception and creation of a formal plan.
Dec 2021- Research systems theory and identify a tool to use.
Jan 2022- Gather Data and start building the map.
March 2022- Share first draft with stakeholders to get feedback.
April 2022- Promote the project with faculty and staff at the school.
Ongoing: Consultations with stakeholders to update the map and promotion of the map to identify various opportunities to utilize it.
Anticipated launch on Concordia’s University’s website: Fall 2022 in time for orientation of new students.
Financing
I completed the project with no financing since the software used was free. Everyone that contributed to making this project a reality did it for free.
Results
The project was a success and won a Sustainability Research Award at Concordia University with the full support of the Office of Sustainability and with faculty support. We are aiming for an official launch on the school’s website in Fall 2022 as a resource the community can use to learn about sustainability at Concordia and train a new cohort of sustainability ambassadors.
The map is already featured in various workshops and sustainability-related projects at Concordia as an educational tool. And I got to present my finding during the Celebrating Indigenous Expertise in Sustainability conference at Concordia.
I am currently collaborating with a youth-focused non-for-profit in Montreal (Re_Generation) to push other schools to map their sustainability ecosystems. We believe that this tool will help us understand weaknesses in the way our institutions approach sustainability but also allow us to understand who the key actors for change are in the systems we are navigating.
Lessons Learned
Sustainability is complex, and we need a common framework, a "knowledge domain," to understand it. Systems theory and maps can help us make sense of this complexity, and by intergrating interactive design, we can help people engage with information in a more meaningful way. There are lots of tools out there to help us make sense of the complexity of our organizations and we should use them to ensure that our policies and solutions take in account the whole picture, the whole system.

